Difference between revisions of "BirdSim"
(Created page with " == Introduction == BirdSim is an interactive web-browser embedded application for interactively looking at GPS tracks, from both top down and from Birds-eye view. It is based ...") |
|||
| Line 1: | Line 1: | ||
| − | |||
== Introduction == | == Introduction == | ||
| − | BirdSim is an interactive web-browser embedded application for interactively looking at GPS tracks, from both top down and from Birds-eye view. It is based on the [[BirdView]] application, and as such has some similarities. However, it contains some improvements, allowing for new features such as Touring and location/time dependent (meteorological) data. | + | BirdSim is an interactive web-browser embedded application for interactively looking at GPS tracks, from both top-down view and from Birds-eye view. It is based on the [[BirdView]] application, and as such has some similarities. However, it contains some improvements, allowing for new features such as Touring and location/time dependent (meteorological) data. |
===Requirements=== | ===Requirements=== | ||
| Line 9: | Line 8: | ||
The requirements for BirdSim are similar to those of [[BirdView]] | The requirements for BirdSim are similar to those of [[BirdView]] | ||
| − | === | + | == Control Panel == |
| − | |||
| − | |||
| − | |||
| − | |||
| − | |||
| − | |||
| − | |||
| + | The Google Earth map is controlled by standard mouse interactions, for functions such as zooming, panning and rotation. | ||
| − | + | The interface for querying and controlling GPS data in BirdSim is located in the Control Panel on the left side of the screen. | |
| − | + | ===BirdSim tab=== | |
| − | + | [[image:birdsimControl1.png|thumb|right|260px|Screenshot of the BirdSim Control interface]] | |
| − | + | In the BirdSim tab you can find most of the interface controls for selecting the data in the FlySafe database. It allows you to specify the date and time your interested in, the radar beams you want to include in your queries, the bounding box for the meteorological data, and allows you to switch part of the visualization off and on as desired. Below we go into more detail on different parts of the interface. | |
| − | |||
| − | |||
| − | |||
| − | |||
| − | |||
| − | |||
| − | |||
| − | |||
| − | |||
| − | |||
The topmost 3 fields, named "Date/Time", "Minutes" and "Animation", and their related buttons, are used to navigate trough time, and enable the user to quickly and easily find periods of interest, such as heavy migration. | The topmost 3 fields, named "Date/Time", "Minutes" and "Animation", and their related buttons, are used to navigate trough time, and enable the user to quickly and easily find periods of interest, such as heavy migration. | ||
| Line 45: | Line 28: | ||
* The animation controls can be used to let BirdView Automatically play trough consecutive time-steps. It uses the same size of time-steps as the "back/forward" controls. The interval in seconds between steps of the animation is equal to the number in the box. Default is 3 seconds, but if large data selections are made, it is recommended to take a larger interval for the animation. The animation can be started and stopped with the play and pause button respectively. | * The animation controls can be used to let BirdView Automatically play trough consecutive time-steps. It uses the same size of time-steps as the "back/forward" controls. The interval in seconds between steps of the animation is equal to the number in the box. Default is 3 seconds, but if large data selections are made, it is recommended to take a larger interval for the animation. The animation can be started and stopped with the play and pause button respectively. | ||
| − | === | + | === Weather tab === |
| − | + | [[image:birdsimControl2.png|thumb|right|260px|Screenshot of the BirdSim Weather Control interface]] | |
| − | |||
| − | |||
| − | |||
| − | |||
| − | |||
| − | |||
| − | |||
| − | |||
| − | |||
| − | |||
| − | |||
| − | |||
| − | |||
The FlySafe database contains a large collection of meteorological data, including wind speed, temperature and precipitation, for an area covering Scandinavia to North Africa. | The FlySafe database contains a large collection of meteorological data, including wind speed, temperature and precipitation, for an area covering Scandinavia to North Africa. | ||
For looking at continental migration, this data can be an invaluable asset, but it also puts a strain on the database, since loading large areas can result in long loading times. | For looking at continental migration, this data can be an invaluable asset, but it also puts a strain on the database, since loading large areas can result in long loading times. | ||
| Line 70: | Line 40: | ||
* Precipitation | * Precipitation | ||
* Temperature | * Temperature | ||
| − | |||
| − | |||
| − | |||
| − | |||
| − | |||
| − | |||
| − | |||
| − | |||
| − | |||
| − | |||
| − | |||
| − | |||
| − | |||
| − | |||
| − | |||
| − | |||
| − | |||
| − | |||
| − | |||
| − | |||
| − | |||
| − | |||
| − | |||
| − | |||
| − | |||
| − | |||
| − | |||
| − | |||
| − | |||
| − | |||
| − | |||
| − | |||
| − | |||
| − | |||
| − | |||
| − | |||
| − | |||
| − | |||
| − | |||
| − | |||
| − | |||
==== Meteorological data ==== | ==== Meteorological data ==== | ||
| Line 145: | Line 74: | ||
===== Legend ===== | ===== Legend ===== | ||
| − | |||
| − | |||
===KML Documents === | ===KML Documents === | ||
| − | + | In this tab, you can either add kml/kmz files from somewhere on the web, or upload a local kml file. | |
| + | The second option | ||
| + | === Other Tabs === | ||
| − | + | There are a few other tabs, such as "Find Location", "Google Earth Layers" and "Options". These control some of the Google Earth plugin basic behaviors and properties, and are not documented here | |
| − | |||
| − | |||
| − | |||
| − | |||
| − | |||
| − | |||
| − | |||
| − | |||
| − | |||
== Security == | == Security == | ||
| − | The | + | The BirdSim application itself runs on the https protocol, and requires a FlySafe server user account to access. |
| − | + | The FlySafe | |
| − | The | ||
* A username and password | * A username and password | ||
* Your IP-address should be registered | * Your IP-address should be registered | ||
| − | |||
| − | |||
== Known problems/Troubleshooting == | == Known problems/Troubleshooting == | ||
| − | + | None as of 21-3-2011 | |
| − | |||
| − | |||
| − | |||
| − | |||
| − | |||
| − | |||
| − | |||
| − | |||
| − | |||
| − | |||
| − | |||
| − | |||
| − | |||
| − | |||
| − | |||
| − | |||
| − | |||
| − | |||
Revision as of 14:34, 21 March 2011
Contents
Introduction
BirdSim is an interactive web-browser embedded application for interactively looking at GPS tracks, from both top-down view and from Birds-eye view. It is based on the BirdView application, and as such has some similarities. However, it contains some improvements, allowing for new features such as Touring and location/time dependent (meteorological) data.
Requirements
The requirements for BirdSim are similar to those of BirdView
Control Panel
The Google Earth map is controlled by standard mouse interactions, for functions such as zooming, panning and rotation.
The interface for querying and controlling GPS data in BirdSim is located in the Control Panel on the left side of the screen.
BirdSim tab
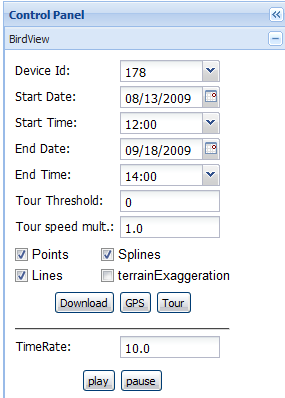
In the BirdSim tab you can find most of the interface controls for selecting the data in the FlySafe database. It allows you to specify the date and time your interested in, the radar beams you want to include in your queries, the bounding box for the meteorological data, and allows you to switch part of the visualization off and on as desired. Below we go into more detail on different parts of the interface.
The topmost 3 fields, named "Date/Time", "Minutes" and "Animation", and their related buttons, are used to navigate trough time, and enable the user to quickly and easily find periods of interest, such as heavy migration.
When BirdView is started, the date and time default to UTC, rounded down to the hour. UTC is used, because the data in the database uses UTC timestamps, and by using UTC we avoid confusion as to timezones and daylight savings.
To navigate trough time, there are two options:
- To go to a specified date and/or time, you can simply fill in a specific date/time in the box, and press the "go" button. The data in BirdView will automatically update for the new period.
- To move backward and forward trough time, you can use the back and forward arrow icons respectively. The amount of minutes in the box is the size of the time-steps. The data in BirdView will automatically update for the new time-step. The default time-step is 30 minutes, equal to the time between consecutive radar images.
- The animation controls can be used to let BirdView Automatically play trough consecutive time-steps. It uses the same size of time-steps as the "back/forward" controls. The interval in seconds between steps of the animation is equal to the number in the box. Default is 3 seconds, but if large data selections are made, it is recommended to take a larger interval for the animation. The animation can be started and stopped with the play and pause button respectively.
Weather tab
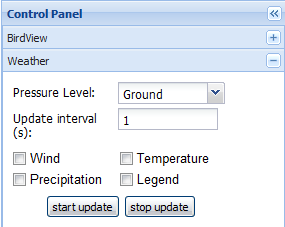
The FlySafe database contains a large collection of meteorological data, including wind speed, temperature and precipitation, for an area covering Scandinavia to North Africa. For looking at continental migration, this data can be an invaluable asset, but it also puts a strain on the database, since loading large areas can result in long loading times. If you are only interested in the weather in the Benelux, the long loading time is quite annoying. Therefore we provide an interface to specify the area of interest. In this interface the user can set a bounding box by providing the minimum and maximum latitude and longitude coordinates. This way, only the meteorological data inside this area is queried and displayed.
In some cases the meteorological data also has different values at different pressure levels in the atmosphere. For example, on lower pressure levels (i.e. higher in the air) the wind direction and speed can be significantly different compared to closer to the ground. Since birds can fly on different heights, this is can be an important factor when looking at bird migration.
These settings are used for :
- Wind Barbs
- Precipitation
- Temperature
Meteorological data
The FlySafe database contains the weather prediction data acquired from ECMWF. The meteorological data goes back as far as 01-01-2005, although only wind vector is available for that particular period.
ECMWF data properties:
- The prediction is 72 hours into the future
- The data is updated every 12 hours, overwriting previous data.
- The last prediction for any 12 hour period is kept in the database
- The data interval is 3 hours, e.g 00:00, 03:00, etc.
- The resolution is 0.25 degrees latitude and longitude (currently, was 0.5 in the past)
- The current boundaries are Longitude -17 to 45 degrees, Latitude 5 to 62 degrees
- Some variables (temperature, wind speed) have multiple altitude levels. Currently, these include ground, 1000, 925, 850, and 700, given in milliBar.
Temperature
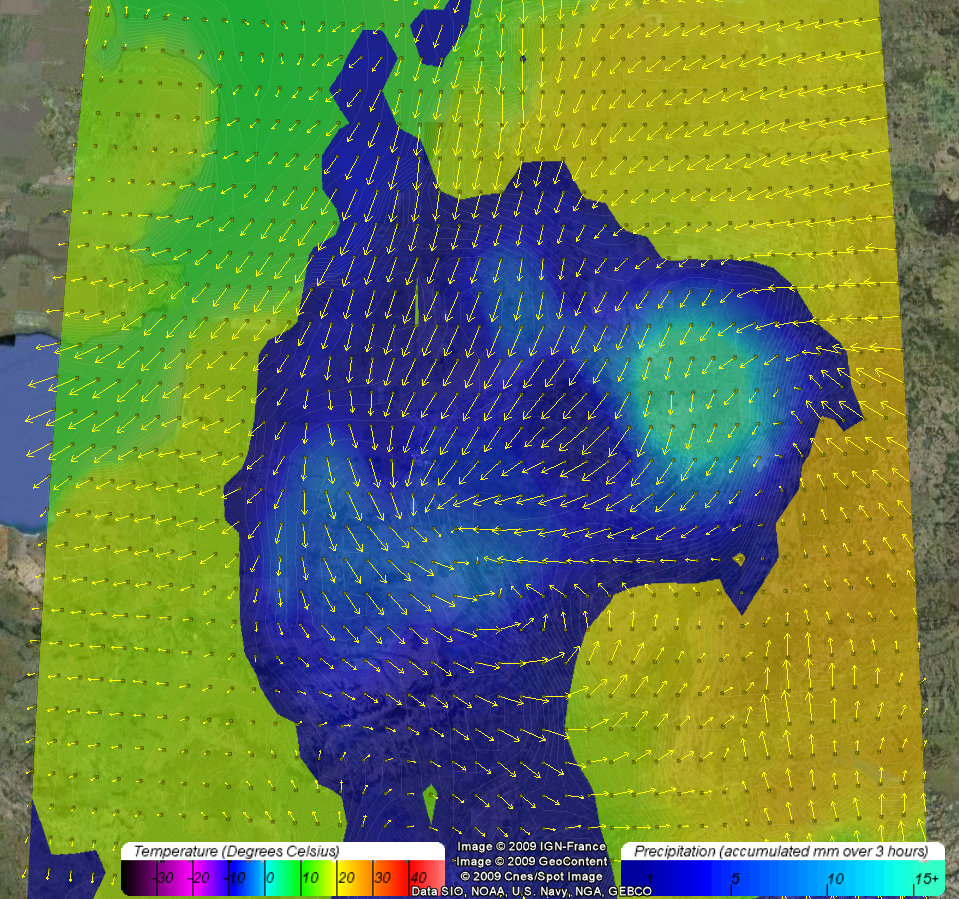
By selecting the temperature option, you get the temperature as a slightly transparent filled contour plot, in an area bounded by the bounding box. The temperature range displayed is limited to a -40 to 50 degrees Celsius range, with a small jump at the freezing point, making it stand out slightly. The legend of the temperature can be found by using the legend option.
Slightly visible white lines have been added to the contour plot to make the different levels of the contour plot easier to see. The levels are 0.33 degrees each, so three different bands will represent one degree in temperature shift.
Wind Vector (Wind Barb)
Wind speed is an important factor in bird behavior. Flying against a strong wind is very inefficient, while flying along with the wind can save a lot of energy. It can often be seen that the general direction of birds is strongly dependent on the wind speed.
If the wind Vector option can be used to visualize the wind speed. It will display the wind in yellow arrows (vectors) where the direction is the wind direction, and the size of the arrow gives an indication of the wind speed.
When the legend option is checked, the wind vectors will be extended with very small icons on the base of the arrow. These icons can be clicked on, and a popup table will tell you the exact properties of the wind vector in that location, with speed in both U/V component, and in absolute speed/heading.
Precipitation
By selecting the precipitation option, you get the accumulated precipitation for the last full 3 hour period (e.g. if you do it for example at 04:00, you get the precipitation from 00:00-03:00). This value is calculated by subtracting the previous accumulated value from the current accumulated value, giving us the accumulated value of that 3 hour period.
The precipitation is visualized as a slightly transparent filled contour plot, in an area bounded by the bounding box. Everything under 1mm of precipitation is ignored, the rest is shown in a scale of dark blue to light blue. The range goes to 15+ mm, everything higher gets the same color as the 15mm level.
The precision of the plot is 0.5 mm per color level.
Legend
KML Documents
In this tab, you can either add kml/kmz files from somewhere on the web, or upload a local kml file. The second option
Other Tabs
There are a few other tabs, such as "Find Location", "Google Earth Layers" and "Options". These control some of the Google Earth plugin basic behaviors and properties, and are not documented here
Security
The BirdSim application itself runs on the https protocol, and requires a FlySafe server user account to access. The FlySafe
- A username and password
- Your IP-address should be registered
Known problems/Troubleshooting
None as of 21-3-2011


