Difference between revisions of "BirdSim"
(→BirdSim tab) |
(→Introduction) |
||
| (One intermediate revision by the same user not shown) | |||
| Line 7: | Line 7: | ||
* To dynamically link (meteorological) data to GPS-data. | * To dynamically link (meteorological) data to GPS-data. | ||
| − | + | '''''This service is currently not available.''''' | |
===Requirements=== | ===Requirements=== | ||
| Line 66: | Line 66: | ||
==== Meteorological data ==== | ==== Meteorological data ==== | ||
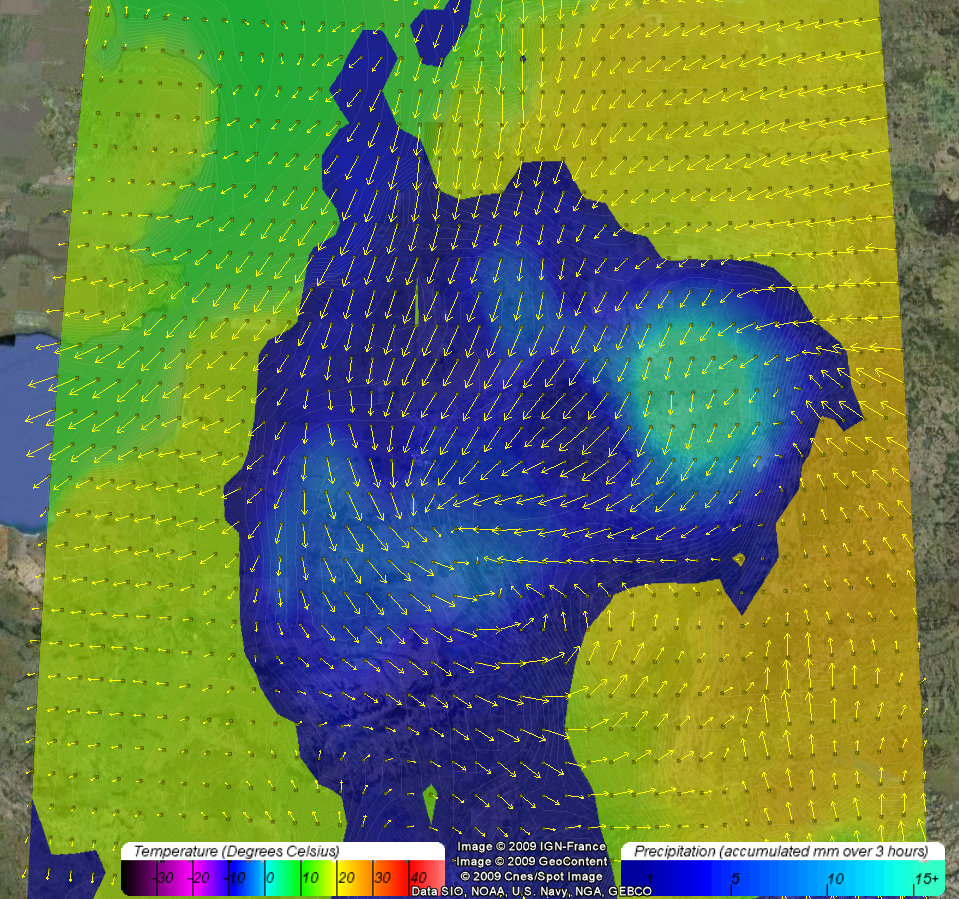
[[Image:ScreenShotMeteo.png|thumb|right|500px|Wind, temperature and precipitation data in BirdView]] | [[Image:ScreenShotMeteo.png|thumb|right|500px|Wind, temperature and precipitation data in BirdView]] | ||
| − | The | + | The e-Ecology database contains the weather prediction data acquired from ECMWF. The meteorological data goes back as far as 01-01-2005, although only wind vector is available for that particular period. |
ECMWF data properties: | ECMWF data properties: | ||
Latest revision as of 11:21, 21 January 2021
Introduction
BirdSim is an interactive web-browser embedded application for interactively looking at GPS tracks, from both top-down view and from Birds-eye view. It is based on the BirdView application, and as such has some similarities. However, it contains some adjustments and additions, allowing for new features such as Touring and location/time dependent (meteorological) data.
BirdSim has two main goals:
- To enable looking at GPS tracks from a birds perspective.
- To dynamically link (meteorological) data to GPS-data.
This service is currently not available.
Requirements
To be able to use BirdSim, you need to fulfill a couple of requirements. Most of these requirements are usually already fulfilled, or in case of installing Google Earth browser plugin, very easy.
- You need to run either Microsoft Windows (XP or later) or Maxc OS X 10.4+ as operating system.
- You need to have a compatible web browser. Internet explorer, Google Chrome and Firefox are known to be compatible, but Firefox is recommended since it provides additional functionality such as opening local kmz/kml files.
- You need to have the Google Earth plugin installed. This can be done very simply provided you have administrator rights. It will query you to install the first time you open
- To retrieve data, you need to be logged in with your UvA-Bit password. See #Security for more details.
We recommend Firefox as browser: While other browser will work too, only Firefox support loading of local KMZ/KML files.
Control Panel
The Google Earth map is controlled by standard mouse interactions, for functions such as zooming, panning and rotation.
The interface for querying and controlling GPS data in BirdSim is located in the Control Panel on the left side of the screen.
BirdSim tab
In the BirdSim tab you can find the controls for querying data from the GPS e-Ecology database.
Here we will go over each field, and explain what this does:
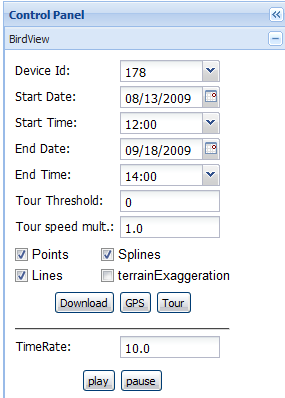
- Device Id: This is the serial number of the bird you want to look at. Note that only the device that you have access to are visible.
- Start date/time and End date/time: Here your set the timespan of the data you want to see. The time is in UTC
- Tour Threshold: Measurement points with an average speed (in m/s) under the threshold are grouped together. This option is to clean up the bird tracks and aggregate spots where they were not travelling.
- Tour Speed Multiplier: The default tour speed is the same as the speed of the measurements. Since this can be extremely slow on migration flights, the default speed can be modified. Note that the touring interface also has buttons to speed up the tour, this option is just an alternative.
- Points checkbox: Adds the measurements to the GPS track/tour as icons.
- Lines checkbox: Add straigt, shortest distance lines between the measurement points (green line)
- Spline checkbox: Add a spline (blue line) through the measurement points. It is a Catmull-Rom spline, which goes trough every measurement point. Note that this the route that the tour follows.
- Terrain Exaggeration checkbox: If this checkbox is checked, the height of the terrain and bird are multiplied with a factor of 3, in order to see more details in the terrain. This is interesting for tour trough hilly/mountainous terrain.
- Download Button: This downloads a KML file containing both the tour and the GPS track.
- GPS button: This displays the requested GPS track in the Earth Panel
- Tour Button: This will show the requested GPS tarck as Tour in the Earth Panel. You have to use the Touring interface in the Earth Panel to start the tour.
Finally, there is a TimeRate (in seconds per second) together with a play/pause button. The reason for these buttons is to have a finer control over the timeslider of Google Earth. The default speed of the Time Slider makes it play very fast, making a migration of a month finish in 10 seconds. By setting the Time rate to for example 3600, the timeslider will advance an hour each second. To update the speed after filling in a new speed, press the play button again.
Environment tab
For the Environment tab to be visible, you do need ECMWF access on the UvA-Bits database. If you do not have this, environment tab won't be visible.
The meteorological data in BirdSim is dynamically queried, based on two factor:
- The viewpoint (both zoom level and position)
- The current time in the Google Earth Timeslider
If the timeslider is giving a single timestamp, this will be used for querying the weather data. If the Timeslider is expanded to a timerange, the end is used to query the data. The position and zoom level are used to determine the extend of the queried data. An area is queried that fills the view in the Google Earth panel, depending on the center of the screen, and the zoom level.
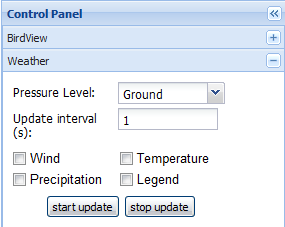
The pressure level dropdown is used for both the temperature and the wind barbs, it has no effect on the precipitation. There are 3 checkboxes for showing and hiding the Wind, Temperature and Precipitation data. A 4th checkbox will show/hide the legend for these visualizations.
Finally, this dynamic querying functionality places a strain on both local processing and server processing, by constantly updating data depending on time and location. Showing a large area by zooming out will load noticeably slower. In order to limit the strain, you can set the update rate to a different value. Furthermore, you have to start the Weather update process yourself by pressing the "start update" button, and vice versa, you can stop the update again by using the "stop update" button.
Meteorological data
The e-Ecology database contains the weather prediction data acquired from ECMWF. The meteorological data goes back as far as 01-01-2005, although only wind vector is available for that particular period.
ECMWF data properties:
- The prediction is 72 hours into the future
- The data is updated every 12 hours, overwriting previous data.
- The last prediction for any 12 hour period is kept in the database
- The data interval is 3 hours, e.g 00:00, 03:00, etc.
- The resolution is 0.25 degrees latitude and longitude (currently, was 0.5 in the past)
- The current boundaries are Longitude -17 to 45 degrees, Latitude 5 to 62 degrees
- Some variables (temperature, wind speed) have multiple altitude levels. Currently, these include ground, 1000, 925, 850, and 700, given in milliBar.
Temperature
By selecting the temperature option, you get the temperature as a slightly transparent filled contour plot, in an area bounded by the bounding box. The temperature range displayed is limited to a -40 to 50 degrees Celsius range, with a small jump at the freezing point, making it stand out slightly. The legend of the temperature can be found by using the legend option.
Slightly visible white lines have been added to the contour plot to make the different levels of the contour plot easier to see. The levels are 0.33 degrees each, so three different bands will represent one degree in temperature shift.
Wind Vector (Wind Barb)
Wind speed is an important factor in bird behavior. Flying against a strong wind is very inefficient, while flying along with the wind can save a lot of energy. It can often be seen that the general direction of birds is strongly dependent on the wind speed.
If the wind Vector option can be used to visualize the wind speed. It will display the wind in yellow arrows (vectors) where the direction is the wind direction, and the size of the arrow gives an indication of the wind speed.
When the legend option is checked, the wind vectors will be extended with very small icons on the base of the arrow. These icons can be clicked on, and a popup table will tell you the exact properties of the wind vector in that location, with speed in both U/V component, and in absolute speed/heading.
Precipitation
By selecting the precipitation option, you get the accumulated precipitation for the last full 3 hour period (e.g. if you do it for example at 04:00, you get the precipitation from 00:00-03:00). This value is calculated by subtracting the previous accumulated value from the current accumulated value, giving us the accumulated value of that 3 hour period.
The precipitation is visualized as a slightly transparent filled contour plot, in an area bounded by the bounding box. Everything under 1mm of precipitation is ignored, the rest is shown in a scale of dark blue to light blue. The range goes to 15+ mm, everything higher gets the same color as the 15mm level.
The precision of the plot is 0.5 mm per color level.
Wadden data
There is a Tide data of the Wadden Sea available between 01-01-2010 and 01-06-2010. This data includes sea surface height and flow speeds with a temporal resolution of an hour. This data is the result of a model run by Deltares, based on meteorological and boundary conditions, not measurements.
Tide-Flow
The tide flow shows arrows (vectors) representing the current speed and direction of the tide.
Tide-Level
The tide level shows a detailed contour of the sea surface height in the Wadden sea
Note: Due to an excessive demand on the server, this option is currently disabled and does not work as of this time. See #Known problems/Troubleshooting
KML Documents
The KML document panel contains the interface to add custom data to BirdView, in the form of KML/KMZ files. These files can be located either on your local machine, in which case you upload them, or they can be retrieved directly form an online location.
Note that while all browsers support loading of online KML/KMZ files, only firefox supports opening local KML and KMZ files.
Add online KML/KMZ files
Here you can add the url of an online KML or KMZ file, and so load it directly in BirdView. Either press "enter" or the little magnifying glass icon.
Add Local KML/KMZ
Note: These are only supported in Firefox
Both the KML and the KMZ options work similar: Press the "browse" button and select the KML or KMZ file you want to upload. The file is then uploaded and opened in BirdView. Depending on the size of the file, this might take a short while.
Other Tabs
There are a few other tabs, such as "Find Location", "Google Earth Layers" and "Options". These control some of the Google Earth plugin basic behaviors and properties, and are not documented here.
Security
The BirdSim application itself runs on the https protocol, and requires a UvA-bits user account to access.
The access to different birds is limited per account. You can only look at data that you have access to. The same goes for the ECMWF weather prediction data. This functionality is limited to accounts with access to the ECMWF data.
Known problems/Troubleshooting
Updated 6-12-2013
Known issues:
- Tide Level option in Wadden data is disabled due to server strain
- Wadden data server is offline


