KMZ Generator Old
Contents
The UvA-BiTS KMZ Generator
The GPS tracking data can be overlaid on maps in a broad range of software packages. This track generator creates a KML file. This KML file can be loaded into Google Earth, but many other GIS-systems also provide KML reading capabilities.
The service itself can be found via the Virtual Lab [1] by selecting "kmz generator" or via direct link at e-ecology website. This requires special access: You need to have credentials and your IP address should be registered. Please contact grid.support@sara.nl if you have problems getting access.
System Requirements
Software Requirements
The webservice itself is standard javascript website, and as such is supported by all modern browsers and operating systems.
For looking at KML files, there are multiple options. The options we support are Google Earth and Birdview.
Hardware requirements
Both Google Earth and Birdview are visual applications, and therefore do require a little bit of graphical power. Fortunately, most modern computers have decent hardware for graphical acceleration, so this should not be a problem. But for example, if the graphical drivers are not installed correctly, or if remote desktop tools are used, performance can be limited.
Additionally, both Google Earth and Birdview require a decent internet connection. They use satellite images as background, and these have to be retrieved from the internet. Furthermore, depending on the size of the selection of Bird tracks in the GPS bird track service, it might
The Interface
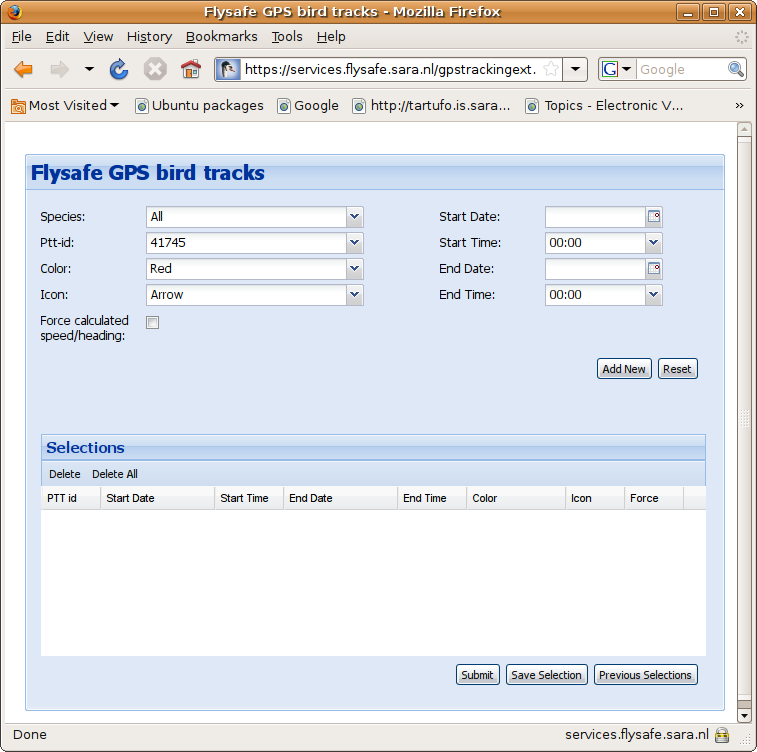
Currently there are 40 different birds available in the database, and records exist from June 2006 and on. In order to be able to select specific bird(s) and timespan(s) for detailed studying, an interface was built that allows users to query and retrieve specified subsets of the available data. See the image to the right for a screenshot of the interface.
To use the GPS service, one must first make one or more bird selections, where "add new" button is used to add a selection to the list. When the user is satisfied with the list, the submit button can be pressed to generate the KML file with all the selected data.
Each individual option in the interface is described in more detail below.
Bird and Time selection
The two drop down menu's in the upper left of the interface are for selection of specific birds. The species drop down, when used, filters the available birds so that only birds of the selected species are visible. The Ptt-id drop down shows all the unique bird ID's. Every single number is a unique bird.
In the upper right of the interface there are selectors to specify the time range. For the begin and end date, there are two options: You can either type a date directly, or you can use the calender button. When you use the calender button, a small window pops up where a desired date can be selected. Here you can either use the arrows, or you can use ctrl up/down and ctrl left/right to change the years and months respectively. If you have selected a year and month, you can click on a day to finalize you date selection. For more detailed time tuning, there are also fields for the hours and minutes. Again, you can either type it, or you can use the drop down to select the desired hour.
Visualization and calculation options
There are a few options in the interface that modify the visual properties of the bird tracks:
- The Color option assigns a specific color to the selected bird track. Here there are two version or each color: normal and range. In the normal option, all icons are the same color, but with the range option, the icons are colored according to speed, where the darker shades correspond to lower speeds, while the whiter shades correspond to higher speeds.
- The icon option lets the user choose between two different icons, the circle and the arrow. The difference is that the arrow shows direction, while the circle does not.
- The Force calculated speed/heading checkbox is an option that forces the underlying scripts to calculate speed and heading instead of using the measured speed and heading in the database. The reason for this is that not all GPS tags had the capability for measuring speed and heading. With this option we provide a homogenized speed/heading option for all type of tags. The calculated speed is the distance divided by the time since last measurement, the calculated heading is the heading of the shortest route from last measurement.
More details about the visualization can be found in #Visualization.
Selection list and Submitting
When you are finished selecting a bird, a timespan and your visualization options, you can add the bird to you current selection list with the "Add New" button. You then have the option of either adding more birds, or if you're satisfied with your selection, you can submit your selection to the server with the "Submit" button. After submitting, you have to wait a bit (depending on the size of your selection) while the server queries the database and constructs your KML file.
Because users often have specific bird(s) that they are interested in, it would be tedious to fill in the form with the same selections every time. Therefore we have added functionality to save and load specific selections. To save the current selection, simply press the Save Selection button, choose a name, and press Save. To load a previously saved selection, simply press the Previous Selections button, select the list your interested in, and press Load.
It must be noted that the selection are saved as cookies, and are therefore browser specific, and can be lost over time.
Visualization
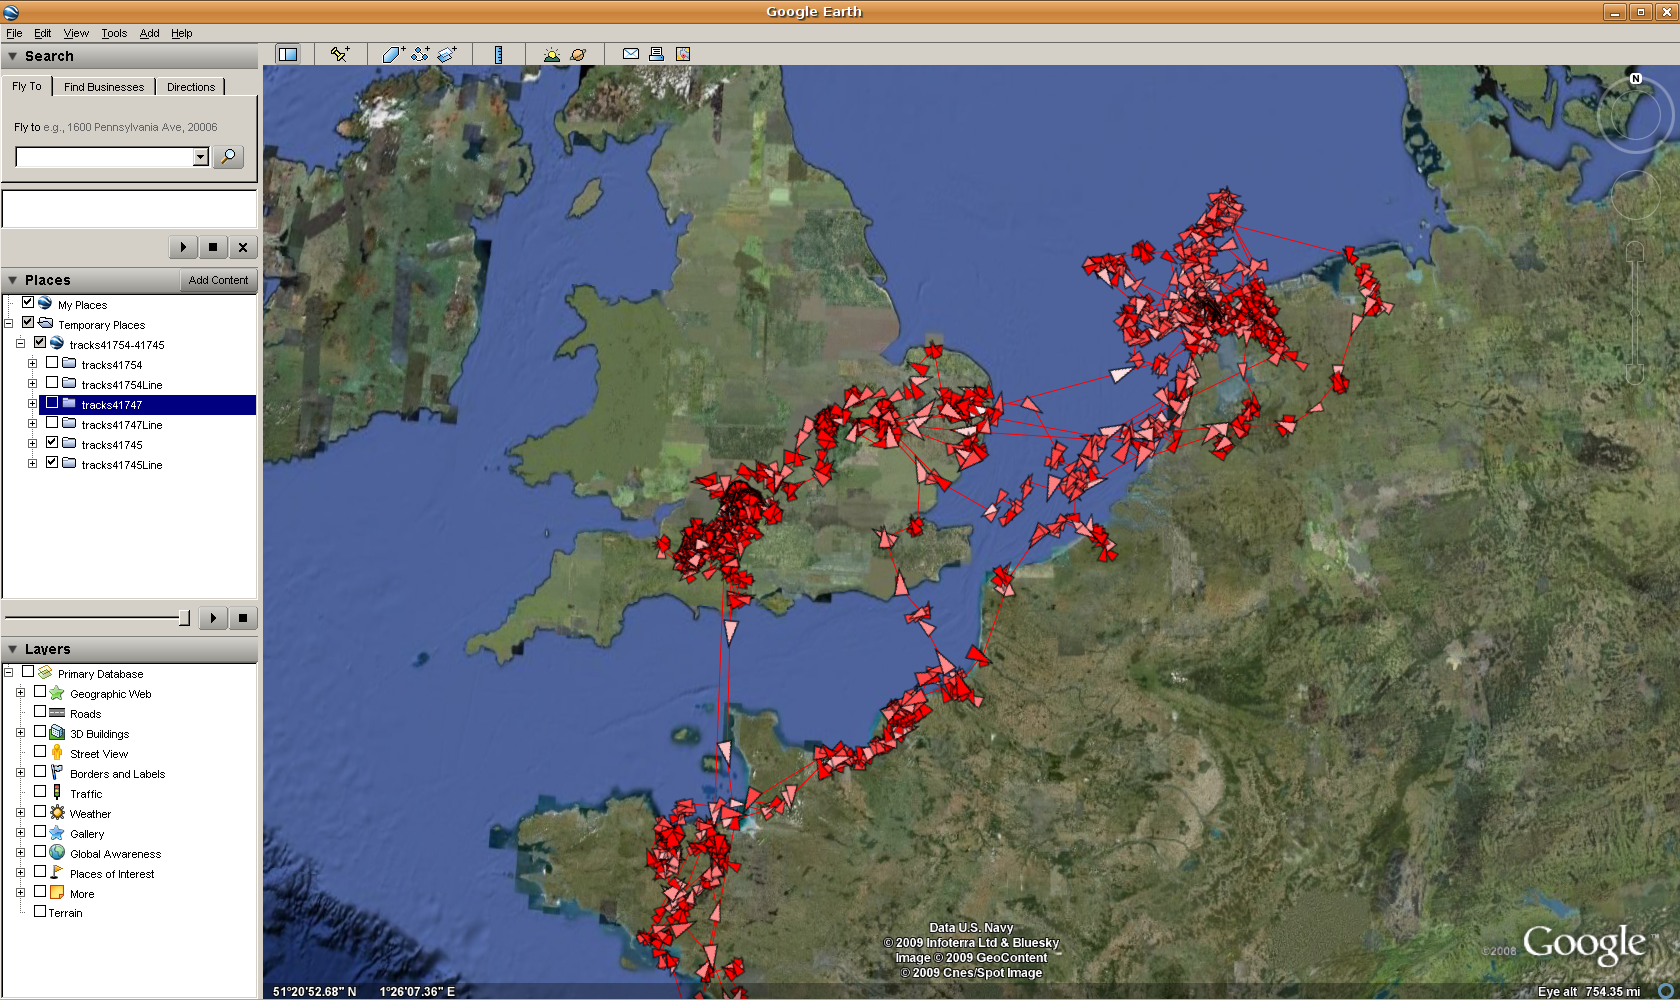
The GPS service generates KML files containing one or more bird tracks. Currently, it saves the resulting file as tracks<#1>-<#2>.kml, where <#1> is the lowest bird ID, and <#2> the highest bird ID in the file. The kml itself can be viewed with a variety of applications, provided they support the KML format of files. In this documentation, we will limit ourselves to the use of Google Earth.
Data Representation
The data of each bird track consists of two different parts. The first part is a simple line of the chosen color showing the route that the bird has flown between the selected dates. The route is created by connecting all the GPS measurements in order of their timestamps. This gives a clear view of foraging and migratory habits over longer periods of time.
The second part is a collection of icons, each one representing a GPS tag measurement on a certain time-step, and located on the latitude/longitude of the measurement. Each icon has several different visual indications of the measurement, such as:
- The size of the icon is an indication of the altitude of the measurement, where the bigger icon represents a higher altitude.
- The color of the icon is an indication
Because one bird track can consist of a large number of measurements, which are sometimes located in a small area, there are several tricks that can be used when looking at the data in Google earth.
- Because each measurement has a timestamp attached to it, you can use the built in Google Earth time slider to specify
BirdView
An alternative way of looking at the GPS bird track kml files is with BirdView. BirdView is the name of a FlySafe webservice built with the Google Earth plugin. Looking at GPS bird tracks in BirdView would allow you to compare GPS track data with the other forms of data available in BirdView.
The current support of kml files in BirdView is slightly complicated though. It consists of two different steps:
- First the kml file has to be made publicly available on the internet, for example by putting it in your personal home space of a website you have.
- Then you can use BirdView to load the kml file, by providing a full internet link to your kml file under the KML Document tab of BirdView.
We hope to make the process of loading kml files into BirdView easier in the future, but for now it works trough loading kml files form the internet.
Underlying Query and Data
The data in the database is produced with different models of GPS trackers. The result is that not every bird has exact the same data available. However, in order to provide compatibility, they are all put in the same table, but with the older models having certain fields empty. The following query is used:
 SELECT g.ptt_id, i.species, g.date_time, g.latitude, g.longitude, g.speed, g.course, g.altitude,
   g.alt_status, g.quality, g.user_qc, g.parser_qc, g."location", elevation.srtm_getvalue(g."location")
   AS elevation, case when g.altitude = 0 then NULL else (g.altitude - elevation.srtm_getvalue(g."location")) end AS agl
   FROM gps.gps_tracking_data g, gps.individual i, gps.track_session t
   WHERE g.ptt_id = t.ptt_id AND g.date_time >= t.start_date
   AND i.ring_number = t.ring_number AND g.parser_qc = 1 AND g.ptt_id = <ptt_id>
   AND g.date_time >= <startTime> AND g.date_time <= <endTime>
   AND g.latitude <> 0 ORDER BY g.date_time
This query returns a table of tracks, which then if filtered so that all entries with either 'quality' =="FAILED"' or 'parser_qc' >1' are removed, because these measurements were considered errors

