KMZ Generator2
Contents
The UvA-BiTS KMZ Generator
The UvA-BiTS GPS tracking data can be overlaid on maps in a broad range of software packages. This track generator creates a KMZ file which can be loaded into Google Earth, as well as many other GIS-systems which provide KMZ reading capabilities.
The service itself can be found via the Virtual Lab [1] by selecting "kmz generator". This requires special access: You need to have credentials and your IP address should be registered. Please contact UvA-BiTS@uva.nl if you have problems getting access.
System Requirements
Software Requirements
The webservice itself is standard javascript website, and as such is supported by all modern browsers and operating systems.
For looking at KML files, there are multiple options. The options we support are Google Earth and Birdview.
Hardware requirements
Both Google Earth and Birdview are visual applications, and therefore do require a little bit of graphical power. Fortunately, most modern computers have decent hardware for graphical acceleration, so this should not be a problem. But for example, if the graphical drivers are not installed correctly, or if remote desktop tools are used, performance can be limited.
Additionally, both Google Earth and Birdview require a decent internet connection. They use satellite images as background, and these have to be retrieved from the internet. Furthermore, if large amounts of data are selected in the kmz generator, performance issues may arise.
The Interface
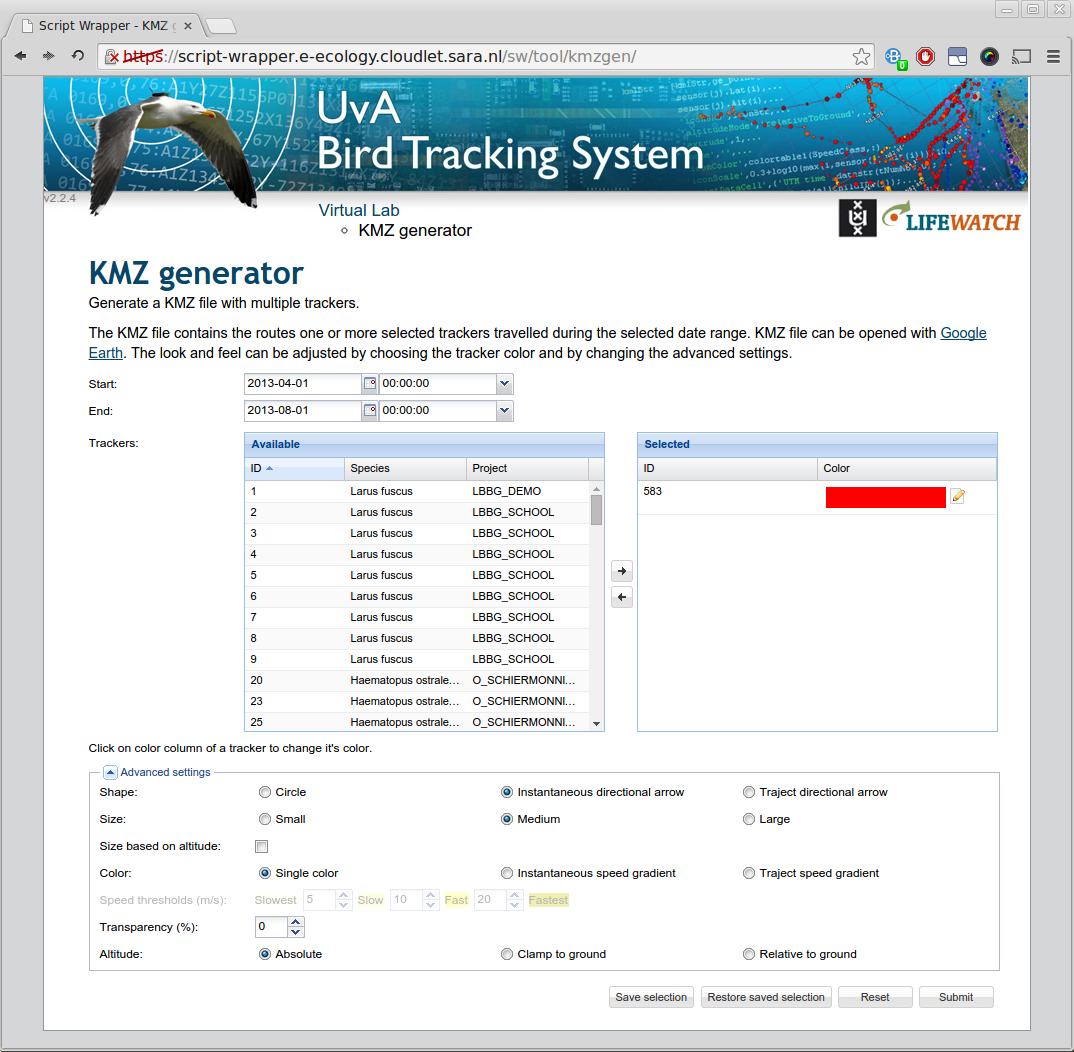
Records exist from May 2008 and onwards. In order to be able to select specific bird(s) and timespan(s) for detailed studying, an interface was built that allows users to query and retrieve specified subsets of the available data. See the image to the right for a screenshot of the interface.
To use the KMZ generator:
- Select start date and end date
- Select trackers
- Customize tracker color
- Advanced settings (optionally)
- Save selection (optionally)
- Press submit button
- Wait for kmz to be generated
- Download kmz and open it Google Earth
Select start date and end date
For the begin and end date, there are two options: You can either type a date directly, or you can use the calendar button. When you use the calendar button, a small window pops up where a desired date can be selected. Here you can either use the arrows, or you can use ctrl up/down and ctrl left/right to change the years and months respectively. If you have selected a year and month, you can click on a day to finalize you date selection. For more detailed time tuning, there are also fields for the hours and minutes. Again, you can either type it, or you can use the drop down to select the desired hour.
Select trackers
To select trackers they must be moved from the 'Available' table to the 'Selected' table. Moving tracker can be done in 3 ways:
- double click on tracker
- drag and drop
- select it and press arrow button
Multiple trackers can be selected at the same time.
Customize tracker color
The selected trackers are automatically assigned colors. The colors can be changed by clicking on the colored bar or pencil icon. A list of colors will be shown, clicking will select it.
Advanced settings
The advanced settings can be opened by clicking on the Advanced settings text on between the tracker selection and submit buttons. Available settings:
- Shape, use a circle icon or an directional arrow. The direction can be based on instantaneous direction (the direction the GPS tracker reported) or traject direction (direction between current point and previous point)
- Size, use small, medium or large icons
- Size based on altitude, when checked the icons will be bigger when altitude is higher.
- Color, can be single color or a gradient. Which color gradiention to use is based on the speed. The higher the speed the darker. Same as directional arrow there is a choice between instantaneous and trajectory speed.
- Speed thresholds, when speed gradient is selected for color then you can choose at which speed which color should be used.
- Transparency, when you have many points or lines in the same place transparency can be used to make density map by making the points and lines more transparent.
- Altitude, the altitude of points can be configure to be:
- absolute, will use the altitude of the tracker
- clamp to ground, will snap the point to the ground
- relative to ground, the ground elevation will be subtracted from the altitude of the tracker
Save selection
Users often are interested in the same trackers. It would be tedious to select the same trackers each time. Therefore we added functionality to save and load specific selections. To save the current selection, press the Save selection button, choose a name, by default the current time will be used. To restore a saved selection, press the Restored saved selection button, double click on the name or press the icon with the arrow.
As a bonus the last submitted selection is always saved as Last used. This can be used when you want to make the same kml file again or make small changes without configuring everything again.
It must be noted that the saved selections are browser specific. So will not show up when using a different computer.
Limitations
The KMZ generator will give a error when you try to make a KMZ file with more than 50.000 datapoints in total. The error will tell you how many data point are currently selected.
Visualization
The KMZ generator generates KMZ files containing one or more trackers. Currently, it saves the resulting file as t<trackers>-s<starttime>-e<endtime>.kmz , where <trackers> is a list of tracker identifiers separated by and _, <starttime> is the start time in yyyymmddhhmm format and <endtime> is the endtime in yyyymmddhhmm format. The kmz itself can be viewed with a variety of applications, provided they support the KML format of files. In this documentation, we will limit ourselves to the use of Google Earth.
Data Representation
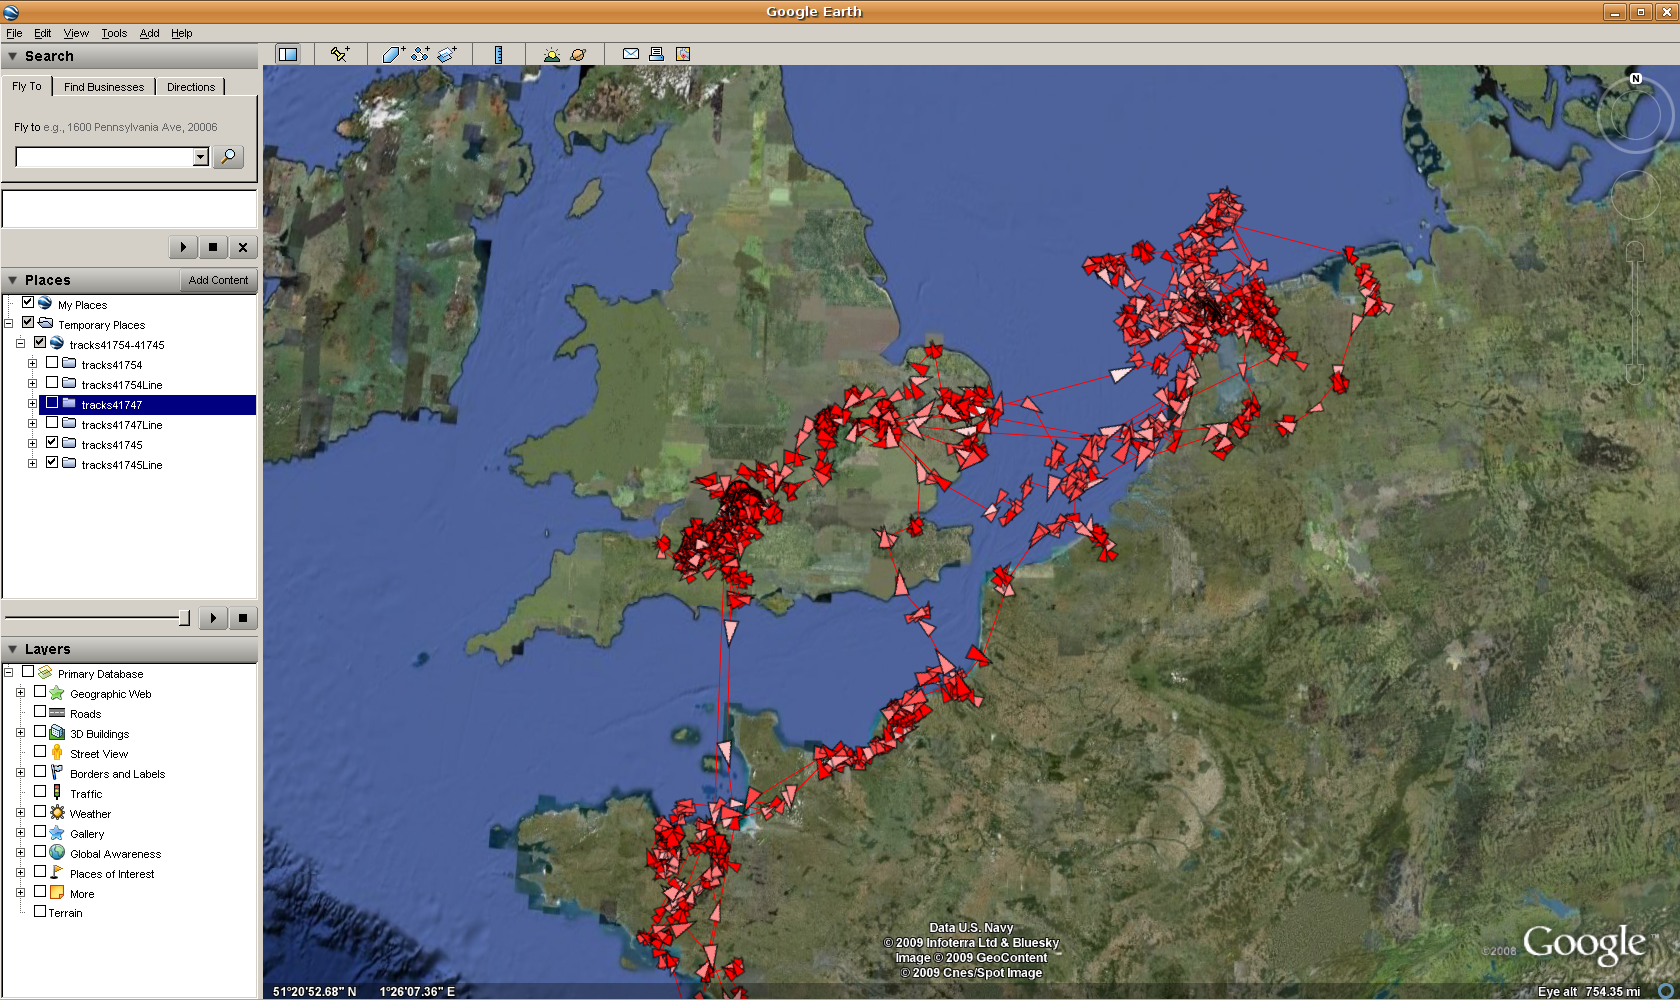
The data of each bird track consists of two different parts. The first part is a simple line of the chosen color showing the route that the bird has flown between the selected dates. The route is created by connecting all the GPS measurements in order of their timestamps. This gives a clear view of foraging and migratory habits over longer periods of time.
The second part is a collection of icons, each one representing a GPS tag measurement on a certain time-step, and located on the latitude/longitude of the measurement. Each icon has several different visual indications of the measurement, such as:
- The size of the icon is an indication of the altitude of the measurement, where the bigger icon represents a higher altitude.
- The color of the icon is an indication of speed
Because one bird track can consist of a large number of measurements, which are sometimes located in a small area.
- Because each measurement has a timestamp attached to it, you can use the built in Google Earth time slider to reduce the number of measurements visible.
Underlying Query and Data
The following sql query is used:
     SELECT
   s.device_info_serial
   s.date_time,
   s.longitude,
   s.latitude,
   s.altitude,
   s.altitude_agl,
   round(CAST(s.speed_2d AS NUMERIC), 2) AS ispeed,
   round(CAST(ST_Length_Spheroid(ST_MakeLine(s.location, lag(s.location) OVER (ORDER BY s.device_info_serial, s.date_time)), 'SPHEROID["WGS 84",6378137,298.257223563]') / EXTRACT(epoch FROM s.date_time - lag(s.date_time) OVER (ORDER BY s.device_info_serial, s.date_time)) AS NUMERIC), 2) AS tspeed,
   round(s.direction, 2) AS idirection,
   round(CAST(degrees(ST_Azimuth(lag(s.location) OVER (ORDER BY s.device_info_serial, s.date_time), s.location)) AS NUMERIC), 2) AS tdirection,
   FROM gps.ee_tracking_speed_limited s
   WHERE
   s.device_info_serial = 583
   AND s.date_time BETWEEN '2013-04-01' AND '2013-06-01'
   AND s.longitude IS NOT NULL
   AND s.latitude IS NOT NULL
   AND s.userflag = 0
   ORDER BY s.date_time
   ;

