Tracker Calendar
Contents
The UvA-BiTS Tracker calendar
The tracker calendar shows daily statistics or metrics of tracker as a calendar heatmap. It can be used to find days when something interesting happened or to find repeating patterns.
The service itself can be found via the Virtual Lab [1] by selecting "Tracker Calendar". This requires special access: You need to have credentials and your IP address should be registered. Please contact UvA-BiTS@uva.nl if you have problems getting access.
Metrics
The following metrics of a tracker are calculated for each day:
- Nr. of GPS measurements
- Nr. of accelerometer measurements
- 2D distance travelled (km): Distance of line which consists of GPS measurements from midnight till midnight, altitude is ignored.
- Maximum altitude (m): Highest absolute altitude
- Average altitude (m): Average absolute altitude
- Minimum altitude (m): Lowest absolute altitude
- Maximum temperature (°C)
- Average temperature (°C)
- Minimum temperature (°C)
- Minimum voltage battery (V): Lowest battery voltage
- Maximum interval between GPS measurements (hh:mm:ss)
- Minimum interval between GPS measurements (hh:mm:ss)
System Requirements
Software Requirements
The webservice itself is standard javascript website, and as such is supported by all modern browsers and operating systems.
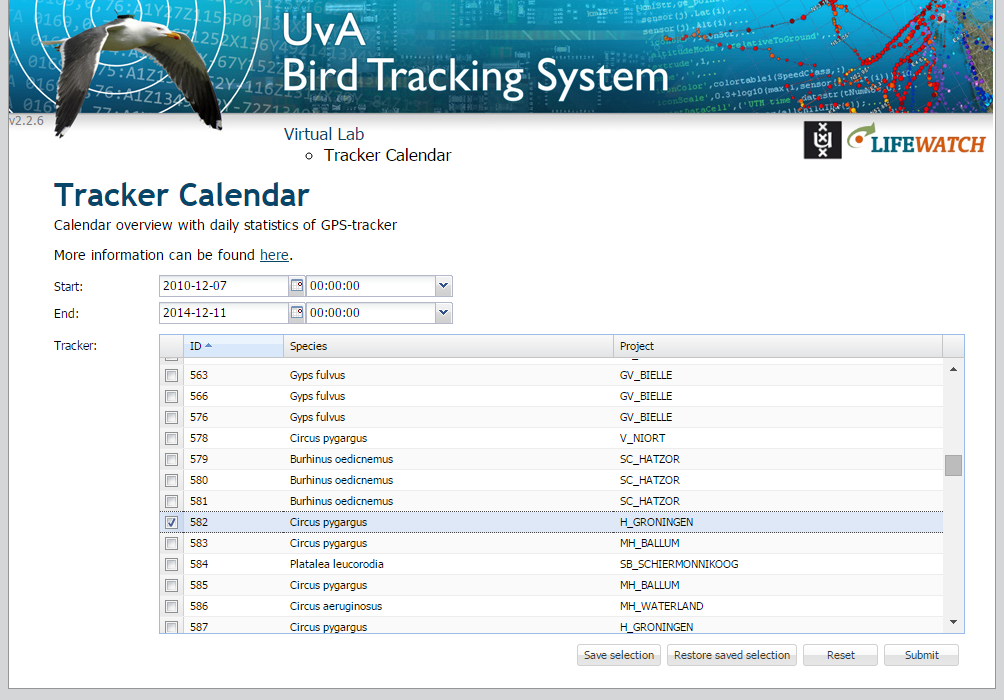
The Submit Interface
Select start date and end date
For the begin and end date, there are two options: You can either type a date directly, or you can use the calender button. When you use the calender button, a small window pops up where a desired date can be selected. Here you can either use the arrows, or you can use ctrl up/down and ctrl left/right to change the years and months respectively. If you have selected a year and month, you can click on a day to finalize you date selection. For more detailed time tuning, there are also fields for the hours and minutes. Again, you can either type it, or you can use the drop down to select the desired hour.
Select tracker
To select tracker click on the row. The checkbox should be checked.
Save selection
Users often are interested in the same tracker. It would be tedious to select the same tracker each time. Therefore we added functionality to save and load specific selections. To save the current selection, press the Save selection button, choose a name, by default the current time will be used. To restore a saved selection, press the Restored saved selection button, double click on the name or press the icon with the arrow.
As a bonus the last submitted selection is always saved as Last used. This can be used when you want to make the same calendar again or make small changes without configuring everything again.
It must be noted that the saved selections are browser specific. So will not show up when using a different computer.
Limitations
The Tracker calendar will give a error when you try to make a calendar with more than 1.000.000 datapoints. The error will tell you how many data point are currently selected.
The Result Interface
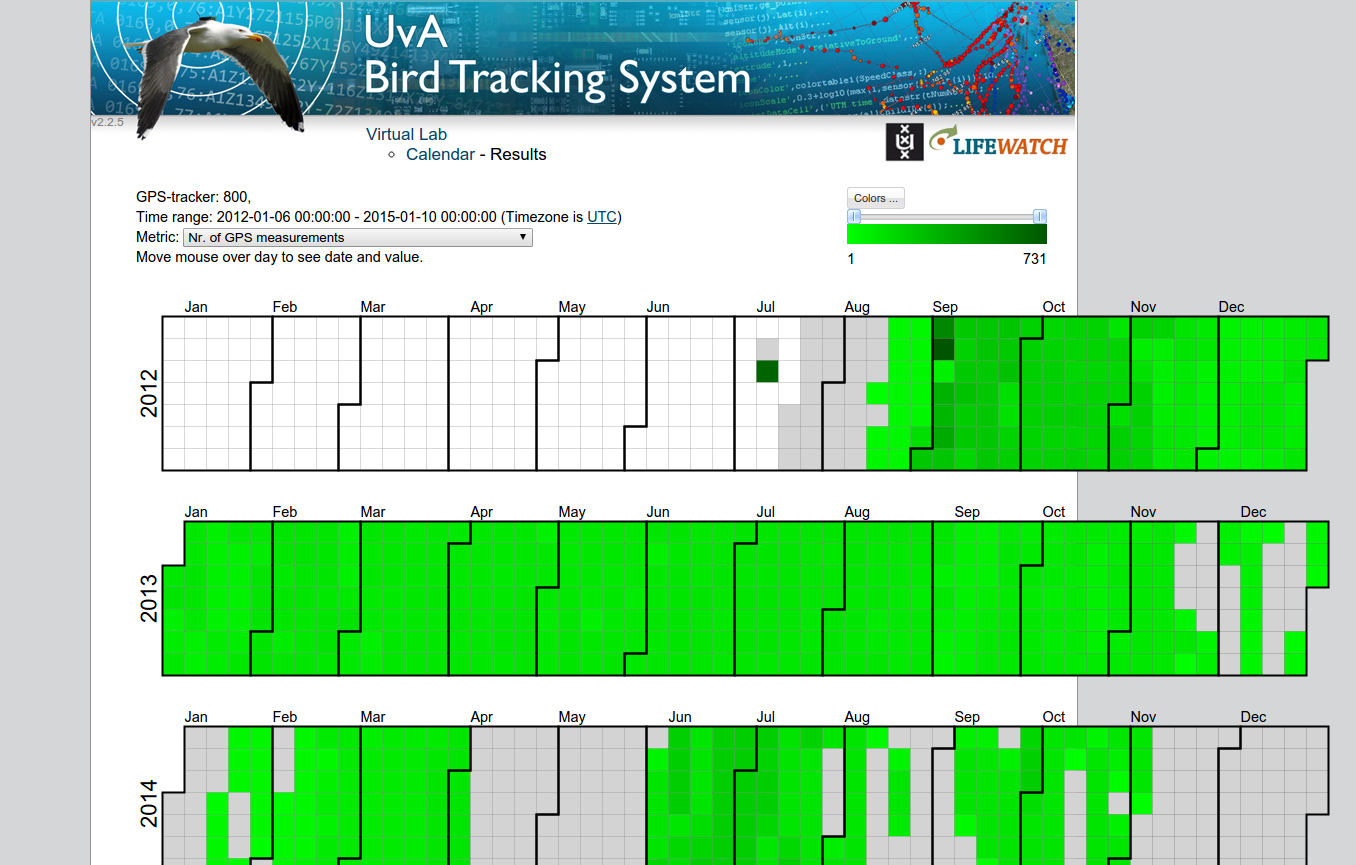
In the top left of the page you can see which tracker, date range and metric has been selected. In the top right of the page you can see the lowest and highest value for the currently selected tracker. The calendar is itself:
- White background: no data for any metric on that day or day is outside selected date range
- Gray background: no data for the selected metric on that day, but another metric has data
- Moving mouse over a day will show the date and value of the metric
On the bottom of the page you can download a csv file with the data shown in the calendar.
Change metric
The combobox at the top left corner of the page can be used to change to a different metric.
Finding outliers
The sliders in the top right corner of the page can be used to find days which are outliers.
Dragging the left slider will change the minimum to a higher value, all days below this value will be colored 'blue'.
Dragging the right slider will change the maximum to a lower value, all days above this value will be colored 'red'.
Dragging the sliders will rescale the colors making it easier to see small changes.
Change colors
The default color range is lowest is light green and highest is dark green. The colors can be changed by
- Press the 'Colors...' button in the top right corner of the page.
- For the color you want to change press the '∨' button
- Pick a color
- Press the 'Select Color' button

